Showing posts with label images. Show all posts

Monday, September 21, 2015

Raster vs Vector Graphics

Computer graphics that are interactive and mutable undergo mathematical transformations. Depending on user’s actions, the computer will take in that information and use different linear algebra principles to transform the image in the way the user intends. These transformations use matrix multiplication to change the graphic.

In order for computer programs or applications to manipulate images they read the image as a matrix, where each entry is a pixel value. Each pixel value is a combination of red, green, or blue (RGB) because computer screen use light, additive color. 
Additive color structure

Different programming languages have built-in libraries with functions that can be used to manipulate individual pixel values. At this point, manipulating graphics refers to filters (black and white, sepia tone, brightness, etc.) applied to images. The programs use nested for loops, or commands encapsulated within each other that run pieces of code for a given number of iterations, to comb through the elements of the two dimensional array. The types of images that would experience manipulations like photo filters are called raster graphics. These are collections of pixels on the screen and they do not have the same mathematical properties as vector graphics. Vector graphics can be scaled and not loose data or quality. This is because they are not just a matrix of pixels, they are defined by paths, curves, and end points. 


Raster graphics are often photos and
vector graphics are usually logos or models.

If a raster image image1 is defined as a matrix and it is being scaled to twice its size then the resulting matrix would have duplicate data  matrix . This redundancy of both rows and columns manifests itself as a pixelated image. When a high quality image is scaled down to a smaller size and saved or stored that way, the data of the image can be lost.

Example of loss of data causing pixelation.

This does not occur with vector images because they are not themselves matrices of image values. Vector shapes are matrices that are read and interpreted differently than rasterized images. 

Example of controls to make vector image.

One area of computer graphics that heavily uses vector shapes is in logos. Logos have to reshaped and resized for different platforms and merchandise. Because vector graphics are stored as paths and points they can be translated and scaled for different programs that read in vector graphics. For example, a pamphlet made in Adobe Illustrator can read in a vector graphic and scale it to a small size without it looking distorted. Additionally, a company that creates billboards can use that same vector graphic file and feature a logo that is completely not pixelated. Vector shapes are also greatly preferred because of the multiple platforms on which media is viewed. A logo can appear crisp on a TV screen and mobile phone.

Wednesday, August 26, 2015

Ray Tracing Graphics Rendering

Whenever I encounter something new and exciting I always want to know how it works. I want to know why it was built the way it is or how it can be customized. When using the program Adobe After Effects, I am stunned by how the preset objects (spheres, particles, lights) look realistic and physically accurate. I wanted to know how a computer could generate objects that incorporated scientific factors like light, reflection, shadows, and physics. Through an independent study with Ithaca College professor Paul Dickson, I got answers.
I worked for a semester with Paul to build a Ray Tracing Graphics Renderer. While that may be a mouthful it is actually a pretty simple concept that translates to complicated coding. The ray tracer that I built used object oriented programming. An object, in this case, is a class that has attributes, accessors, and mutators. 

For example, a sphere object:
attributes: position, radius, color
accessors: getPosition, getRadius, getColor
mutators: setPosition, setRadius, setColor
Image created from my ray tracing graphics renderer featuring planes.

All of these elements together give us an object or blueprint that we can create instances of. Once we have this outline we can have one sphere that is at position (0,0) with a radius of 5 and is red in color, as well as a green sphere at (8,10) with a radius of 2, etc.


Images from my ray tracing graphics renderer before an after
adding a light point in addition to ambient lighting.
In my ray tracer I had lines, spheres, planes, light points, and more. The light points were so that the objects placed in our virtual world could actually be seen. This is where some of the physics of computer graphics rendering came in. I was pretty much able to plug and chug numbers into my program to make the lighting work realistically but there is a lot of mathematics and research that goes into capturing the physics used in graphics renderers.


https://en.wikipedia.org/wiki/User:Timrb/Ray_tracing
A ray tracer works by having a given perspective position or “camera” that sends a ray through every pixel of an image. If a frame of the movie is 1080x1920 pixels then the camera sends out 2,073,600 rays, which explains why ray tracing graphics takes so long and takes so much RAM. A ray has a starting point and travels infinitely in a direction. Sending out a ray means that every position between the camera and the last object in the virtual world is checked to see if it intersects with an object. If the ray intersects with an object then it sets that value of the pixel to be the color value of the objects. Lighting and physics may alter the color of the pixel as well.

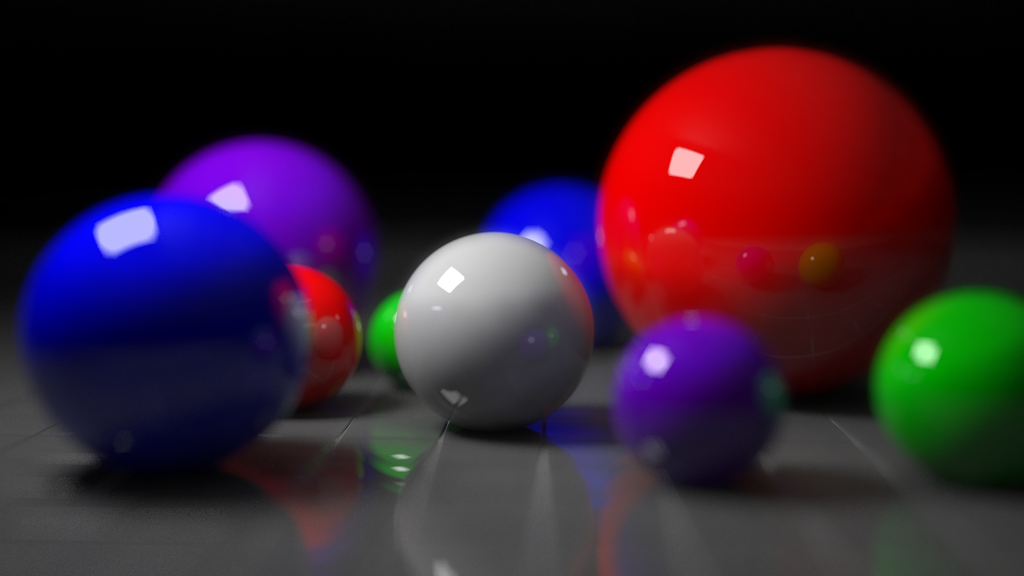
When all of the rays have been sent then every pixel of the image should be colored and you will have final images like these:

Ray traced spheres with added camera effects like focal point and blur.
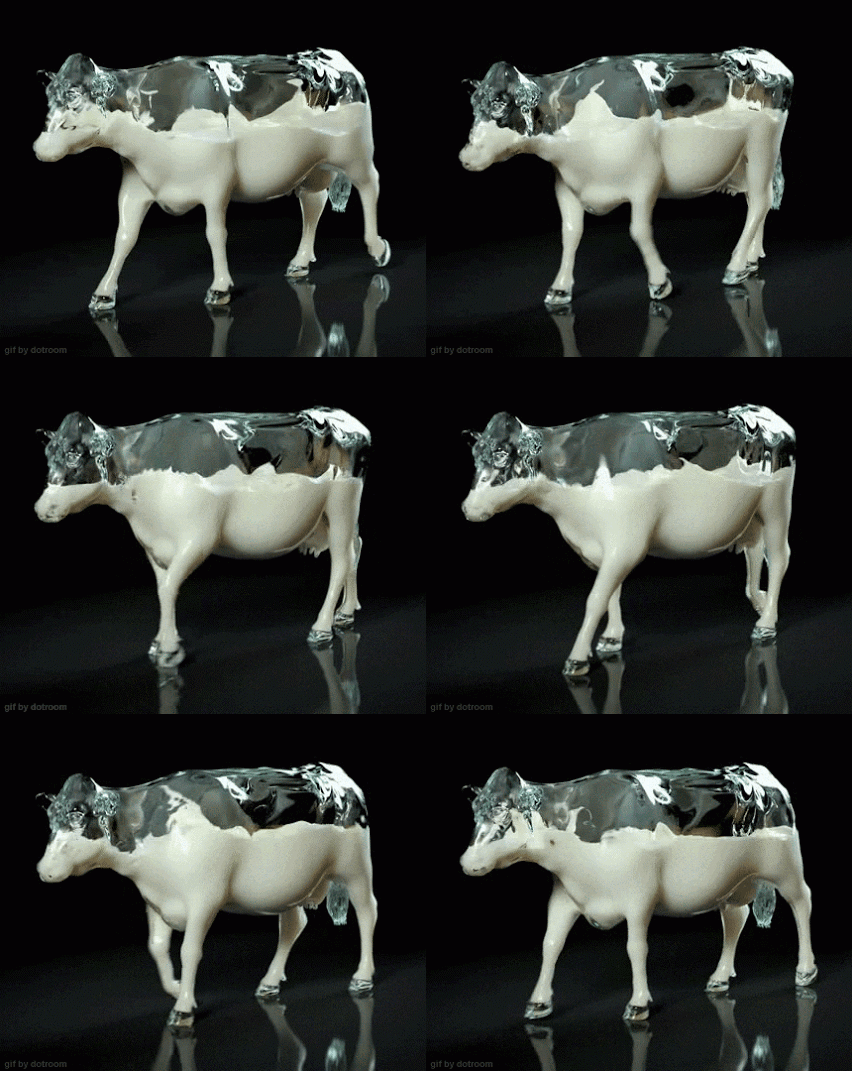
One Dragon object stores all of the dimensions and parameters for the dragon shape
and minor modifications to the values representing the physics of the light
make the dragon look like it is made of different materials.
cac32250476c0257e1e442d3d377efe0.jpg
This was ray traced and it makes me laugh.

Wednesday, January 22, 2014

First blog post for the class... Here it goes!

So I decided to make this post about something that Arturo mentioned towards the end of the class that really sparked my attention: Render-farms. It peaked my interest because I LOVE computer stuff and hearing it made me think about it and want to look more into it. So away we go.

Doing some research online about what a Render-farm is, I come across a slew of images.Taking a look at these, clearly the range in size from small enough to fit into filing drawers or large enough to blow your mind. That's what they would look like. However, when you hear the words "render-farm," I'm sure you're curious to know what it actually is. The simple definition is a large number of computers all wired together in order to render large videos. A more technical definition, according to Wikipedia, the higher the quality of the images and videos, the more processing they would need to keep that quality. When an image needs more processing, clearly more time is going to be needed. So in order to shorten that time, having more computing power does just that. The more computers you have and the more power you have in each of said computers, the faster the rendering will be completed WHILE keeping the quality that you want.

So in retrospect, if you want a feature length film that is shot in 1080p to be finished by a deadline in a week, a Render-farm is most definitely going to be in need.